
One Metric. One Action. Who Does What By When.
The dashboard nobody uses isn't your problem. The one everybody stares at is.

I walked into a plant a few years ago and asked the operations manager what metrics they were tracking.
He pulled up a spreadsheet. Fourteen columns. Downtime, throughput, defect rate, labour hours per unit, machine utilization, first-pass yield, scrap percentage, on-time delivery, customer complaints, inventory turns, and four more I couldn't name without squinting.
I asked him which one he actually managed to.
He paused for a second longer than you'd expect from someone who'd just shown me fourteen answers.
"Honestly? I look at all of them."
Looking at all of them is the same as managing none of them.
Last week I wrote about leading and lagging indicators — and why the number on the board is already history by the time you see it.
Here's the follow-on that nobody wants to hear: I think all indicators are lagging. Even the leading ones.
Why?
Because behind every metric is a person. Someone who decided to do something, or didn't. Someone who spotted a problem and said something, or didn't. The metric is just the record of what already happened — even if that "already" was yesterday's shift instead of last quarter's revenue.
You can't manage a number. You can only manage the people and actions that produce it.
That doesn't mean stop tracking. It means track less, and act more.
The question is how to do that without adding another layer of overhead to a team that's already stretched.
The answer is three columns and one graph.
You're probably thinking: one metric isn't enough. My team has twelve processes and five product lines. I need to know what's happening across all of it.
Maybe. But here's what I've seen in twenty-five years on the floor: the leader who tracks one thing relentlessly beats the leader who monitors everything casually, every time.
Fourteen metrics on a screen is a status report. One metric on a whiteboard is a conversation.
And it's the conversation — the foreman saying "we're at 19% this week and here's what I'm going to do about it" — that actually moves the number.
Here's the system. It takes about ten minutes a week to run.
Pick one metric. Not your favourite. Not the easiest. The one leading indicator that, if it moved in the right direction, would tell you things are working. For a production line running ultrasonically welded inserts, that might be defect rate per run. Not units per hour — that's a lagging output. Defect rate is a signal. It tells you something about the process before the process fails completely.
If you can't describe the metric in one short sentence, pick a different one.
Under that metric, write one action. What is your team doing this week to move it? One action, not five. Five actions is a project plan. One action is a commitment.
Track that action in a three-column table:
| Who | Does What | By When |
|---|---|---|
| Sarah | Recalibrate welding pressure on Line 2 | Thursday AM |
That's it. Who does what by when. The whole system fits on a whiteboard or a half-page spreadsheet. It doesn't require a dashboard or a software subscription or a training session.
Below the action table, track the metric over time in a simple line graph. One axis is weeks. The other is your number. No formatting, no colours, no trend lines. Just the data.
Here is an example of what five weeks looks like for defect rate:
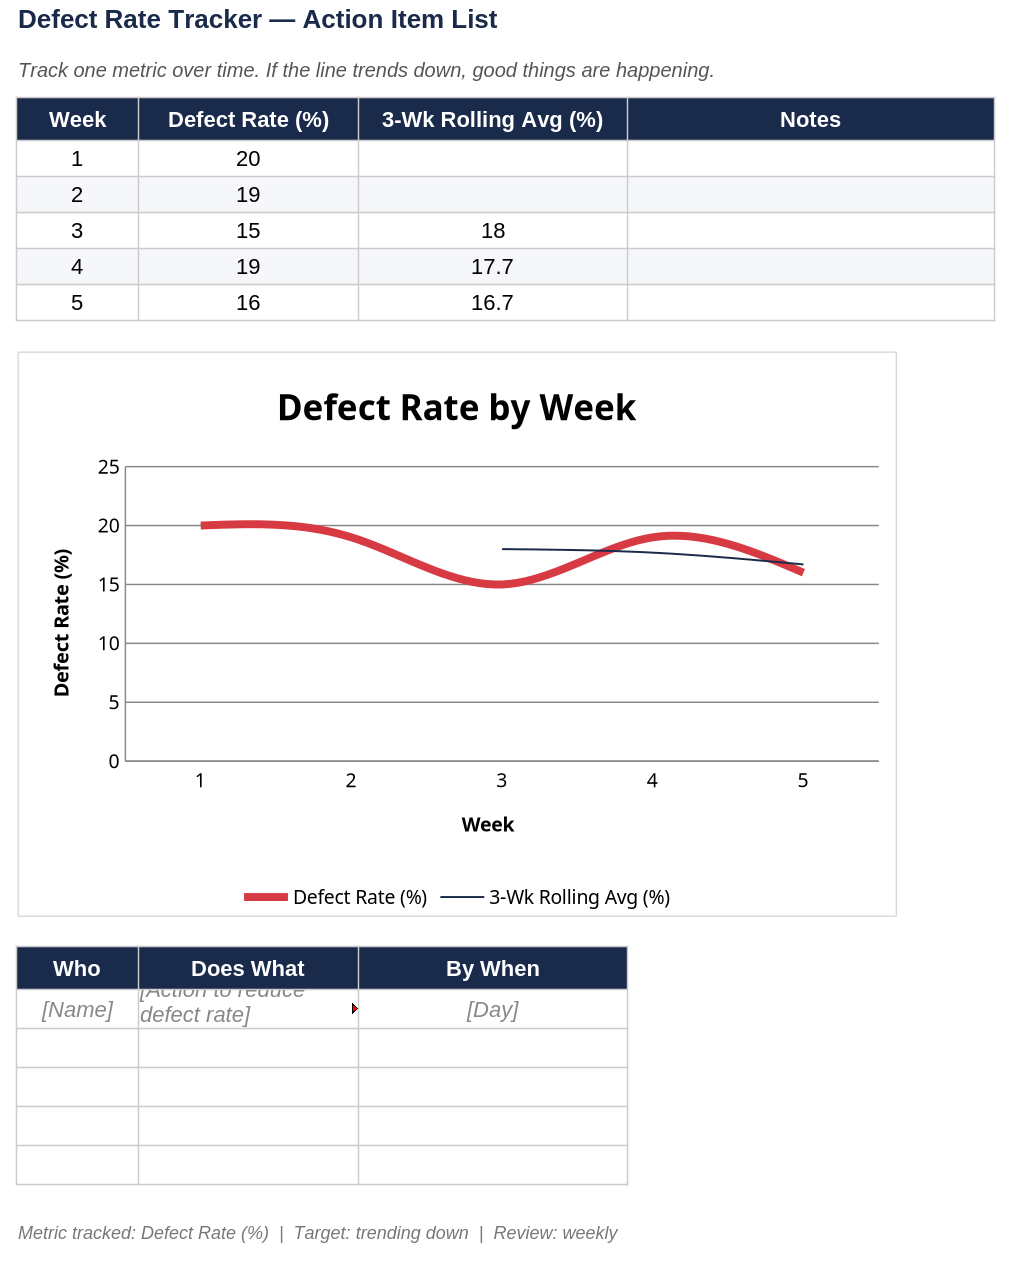
If the line is trending down, things are working. If it's flat or rising, you have a conversation to have.
One thing to add: run a three-month rolling average rather than reacting to each week in isolation. A spike in week three doesn't mean your team had a bad week — it might mean a supplier shipped off-spec material. Performance over time is what matters, not any single data point. The rolling average keeps you from rewarding or punishing your team for noise.
A 55-year-old plant manager in Red Deer doesn't need fourteen KPIs. He needs to know what his team is working on this week and whether it's moving the number that matters.
One metric. One action. Who does what by when.
That's the whole system.
One next step: Pick the single leading indicator that matters most to your operation right now. Write it at the top of a blank page. Below it, write one action your team will take this week to move it. Then write three columns: Who. Does What. By When. Fill in one row. That's your action item list. Run it in your next team meeting.
Further reading:
- The Goal — Eliyahu M. Goldratt (North River Press, 1984). The novel that built the Theory of Constraints — and still the clearest argument for why finding your one constraint and attacking it beats optimizing everything at once.
- Measure What Matters — John Doerr (Portfolio/Penguin, 2018). The OKR case for radical focus: one objective, a handful of key results, and the discipline to say no to everything else.
- The 4 Disciplines of Execution — Chris McChesney, Sean Covey, Jim Huling (Free Press, 2012). The lag vs. lead distinction explained on the floor: focus on the wildly important goal, act on lead measures, keep a compelling scoreboard.